This page refers to v0.10 documentation
Metrics
This is a v0.10 example and need HAProxy Ingress v0.10-snapshot.5 or above
This example demonstrates how to configure Prometheus to collect ingress controller and haproxy metrics, and also to configure a Grafana dashboard to expose these metrics.
Prerequisites
This document has the following prerequisite:
- A Kubernetes cluster with a running HAProxy Ingress controller v0.10 or above. See the getting started guide.
Configure the controller
HAProxy Ingress by default does not configure the haproxy’s prometheus exporter. The patch below configures the haproxy’s internal prometheus exporter in the port 9105:
kubectl --namespace ingress-controller patch configmap haproxy-ingress -p '{"data":{"prometheus-port":"9105"}}'
The following patch adds ports 9105 and 10254 to the HAProxy Ingress container. The port declaration is used by the Prometheus’ service discovery:
Note: this patch will restart the controller!
kubectl --namespace ingress-controller patch deployment haproxy-ingress -p '{"spec":{"template":{"spec":{"containers":[{"name":"haproxy-ingress","ports":[{"name":"exporter","containerPort":9105},{"name":"ingress-stats","containerPort":10254}]}]}}}}'
Deploy Prometheus
This will create a Prometheus deployment with no resource limits, a configuration file which will scrape haproxy and also HAProxy Ingress metrics every 10s, and also a role and rolebinding which allows Prometheus to discover haproxy and controller endpoints using k8s:
kubectl create -f https://haproxy-ingress.github.io/docs/examples/metrics/prometheus.yaml
Note
This deployment has no persistent volume, so all the collected metrics will be lost if the pod is recreated.Warning
If HAProxy Ingress wasn’t deployed with Helm, change the following line in the configmap/prometheus-cfg resource, jobs haproxy-ingress and haproxy-exporter:
       relabel_configs:
-      - source_labels: [__meta_kubernetes_pod_label_app_kubernetes_io_instance]
+      - source_labels: [__meta_kubernetes_pod_label_run]
         regex: haproxy-ingress
This will ensure that Prometheus finds the controller pods.
Check if Prometheus is up and running:
kubectl --namespace ingress-controller get pod -lrun=prometheus -w
Check also if Prometheus found the haproxy and the controller endpoints:
kubectl --namespace ingress-controller port-forward svc/prometheus 9090:9090
Open localhost:9090/targets in your browser, all haproxy and controller instances should be listed, up, and green.
Deploy Grafana
The following instruction will create a Grafana deployment with no resource limit, and also its service:
kubectl create -f https://haproxy-ingress.github.io/docs/examples/metrics/grafana.yaml
Check if Grafana is up and running:
kubectl --namespace ingress-controller get pod -lrun=grafana -w
Create the ingress which will expose Grafana. Change HOST below to a domain of the cluster, or just change the inner IP number to the IP of the HAProxy Ingress node:
HOST=grafana.192.168.1.1.nip.io
kubectl create -f - <<EOF
apiVersion: extensions/v1beta1
kind: Ingress
metadata:
  name: grafana
  namespace: ingress-controller
spec:
  rules:
  - host: $HOST
    http:
      paths:
      - backend:
          serviceName: grafana
          servicePort: 3000
        path: /
  tls:
  - hosts:
    - $HOST
EOF
Configure dashboard
Now its time to see what Prometheus is collecting. Grafana can be acessed in the HOST used to configure the ingress object.
- Log in to Grafana, user is
adminand the first password isadmin - Create a Prometheus data source, the endpoint is
http://prometheus:9090 - Click the big
+plus sign in the left side, and Import this dashboard
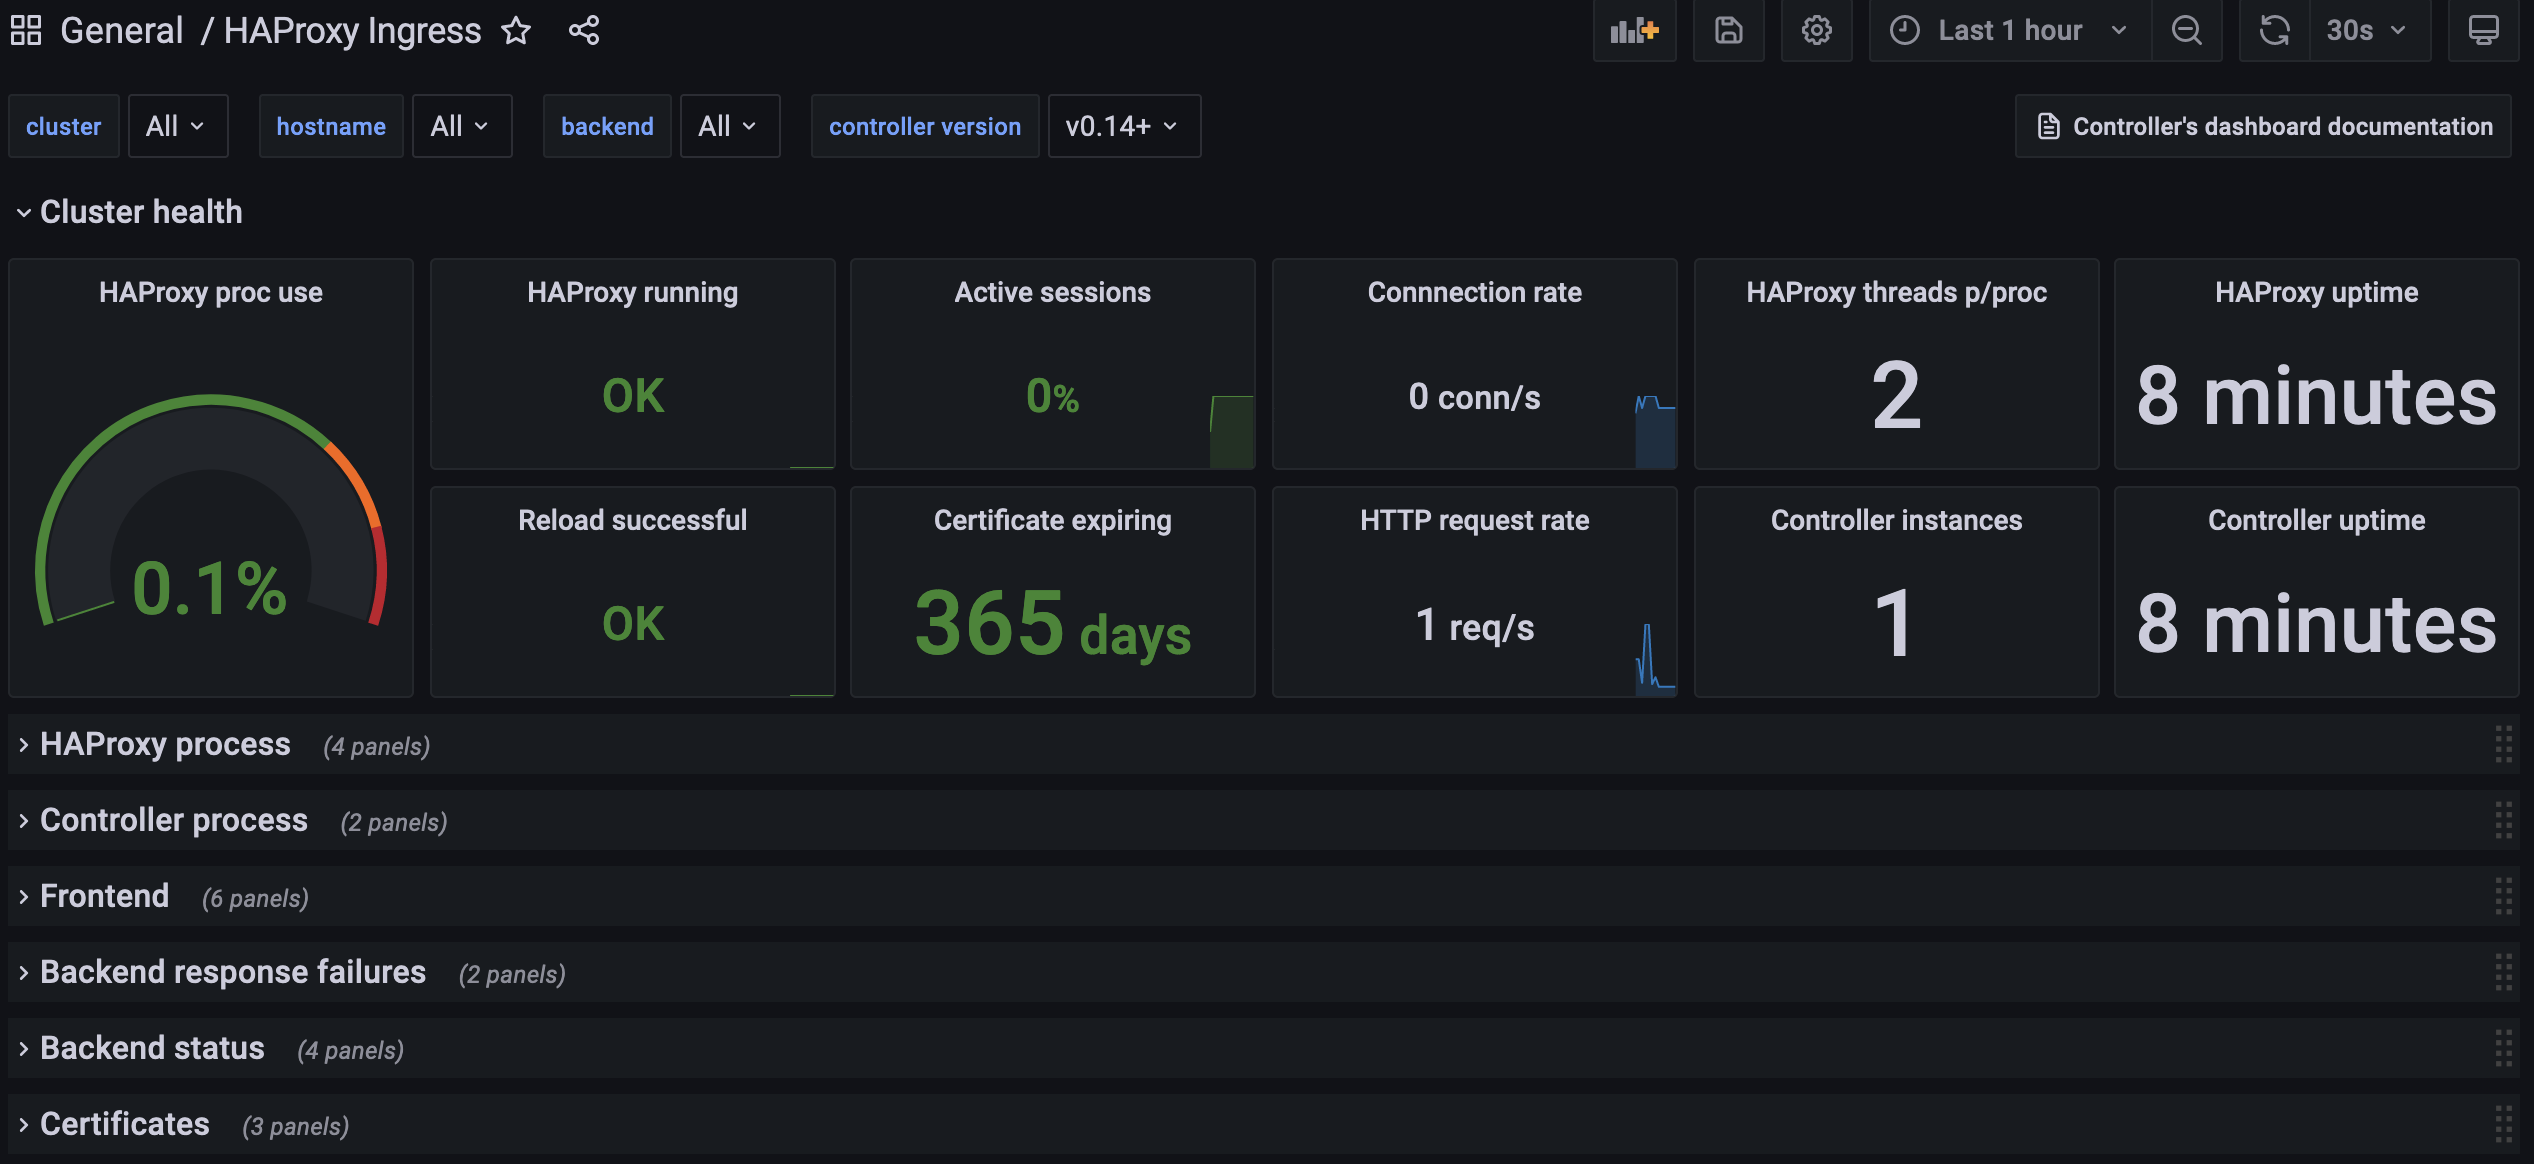
Note
This deployment has no persistent volume, so all customizations will be lost if the pod is recreated.If everything worked as expected, you should see a dashboard like this:
Compatibility
Check if you have any of these scenarios and adjust Prometheus or Grafana accordingly.
Grafana < 6.5
Use Grafana 6.5 or higher. Although an older Grafana won’t refuse to install this dashboard, some widgets will not render as expected on older versions.
The hostname label
All the metrics of this dashboard are grouped by the hostname label. If you already have Prometheus and HAProxy Exporter, ensure that the hostname label uniquely identifies all HAProxy Ingress instances, just like the proposed Prometheus configuration does.
The _front__tls proxy
This dashboard is designed to work without the _front__tls proxy, such proxy is created whenever ssl-passthrough is used or timeout client is configured in the ingress object. Just to be sure, check if grep _front__tls /etc/haproxy/haproxy.cfg find a proxy declaration. If the _front__tls proxy exists, edit the dashboard and change the variable $public_frontend to the following new value: (_tcp_.*|_front_http|_front__tls)
Using the Prometheus’ HAProxy Exporter
This dashboard works with haproxy’s internal Prometheus exporter. Follow these steps to adjust the scrape config and the dashboard if using Prometheus’ HAProxy Exporter:
- Change the metric name of “Backend status / Top 5 max/avg connection time” to
haproxy_backend_http_connect_time_average_seconds Add this
metric_relabel_configin the Prometheus configuration:metric_relabel_configs: - source_labels: [frontend] regex: (.+) target_label: proxy - source_labels: [backend] regex: (.+) target_label: proxy
Test
Lets make some noise and see what the dashboard tell us about our HAProxy Ingress cluster.
Deploy a demo application and a custom (self-signed) certificate:
openssl req -x509 -subj "/CN=whoami.localdomain" -nodes -days 30 -newkey rsa:2048 -keyout /tmp/w.key -out /tmp/w.crt
kubectl --namespace default create secret tls whoami --cert /tmp/w.crt --key /tmp/w.key
rm -fv /tmp/w.crt /tmp/w.key
kubectl --namespace default create deploy whoami --image jcmoraisjr/whoami
kubectl --namespace default scale deploy whoami --replicas=4
kubectl --namespace default expose deploy whoami --port 8000
kubectl create -f https://haproxy-ingress.github.io/docs/examples/metrics/whoami-ingress.yaml
Check if the app is up and running:
kubectl --namespace default get pod -lapp=whoami -w
Download vegeta and place it in the path.
Make a test and check if everything is working as expected. Change IP below to the IP of a HAProxy Ingress node:
IP=192.168.1.1
echo "GET http://${IP}" |\
  vegeta attack -duration=1s -rate=1 -header "Host: whoami.localdomain" -keepalive=true |\
  vegeta report
You should see something like this. The most important part is Success ratio=100% and an Error Set empty:
...
Success       [ratio]                    100.00%
Status Codes  [code:count]               200:1
Error Set:
Now the real test. Adjust the duration and rate (number of requests per second) if needed. A dual core VM dedicated to HAProxy Ingress should accept a few thousands requests per second. Lets configure 200 which should move some lines in the dashoard:
IP=192.168.1.1
echo "GET http://${IP}" |\
  vegeta attack -duration=5m -rate=200 -header "Host: whoami.localdomain" -keepalive=true |\
  vegeta report
Follow the dashboard while the test is running. Most metrics have its resolution in 1m (one minute) so you should wait this time to see the correct conn/s, rps, proc use and so on.
What’s the impact of not use keepalive? Try the same test, changing only -keepalive to false:
IP=192.168.1.1
echo "GET http://${IP}" |\
  vegeta attack -duration=5m -rate=200 -header "Host: whoami.localdomain" -keepalive=false |\
  vegeta report
Last test: what about TLS connections without keepalive? Change http to https and add -insecure command-line option to Vegeta:
IP=192.168.1.1
echo "GET https://${IP}" |\
  vegeta attack -insecure -duration=5m -rate=200 -header "Host: whoami.localdomain" -keepalive=false |\
  vegeta report