Metrics
This example demonstrates how to configure Prometheus and Grafana to collect and expose HAProxy and HAProxy Ingress metrics using Prometheus Operator.
Prerequisites
This document requires only a Kubernetes cluster. HAProxy Ingress doesn’t need to be installed, and if so, the installation process should use the Helm chart.
Configure Prometheus Operator
This section can be skipped if the Kubernetes cluster has already a running Prometheus Operator.
HAProxy Ingress installation configures Prometheus using a ServiceMonitor custom resource. This resource is used by Prometheus Operator to configure Prometheus instances. The following steps deploy Prometheus Operator via kube-prometheus-stack Helm chart.
Create a file named prometheus-operator-values.yaml - change both hostnames with a name that resolves to the Kubernetes cluster, and optionally the admin user and password:
grafana:
  enabled: true
  adminUser: admin
  adminPassword: prom-operator
  ingress:
    enabled: true
    ingressClassName: haproxy
    hosts:
    - grafana.192.168.0.11.nip.io
    tls:
    - hosts:
      - grafana.192.168.0.11.nip.io
Add kube-prometheus-stack helm repo:
helm repo add prometheus-community https://prometheus-community.github.io/helm-charts
Install the chart:
helm upgrade prometheus prometheus-community/kube-prometheus-stack\
  --install\
  --create-namespace --namespace monitoring\
  -f prometheus-operator-values.yaml
Note
Bitnami has also a Prometheus Operator helm chart and it’s also a good option. Note however that the values file has a different syntax.Configure HAProxy Ingress
The steps below configures HAProxy Ingress’ Helm chart to add a new ServiceMonitor custom resource. This resource will be responsible for HAProxy and HAProxy Ingress metrics scrape.
Merge the content below to the actual haproxy-ingress-values.yaml file:
controller:
  ingressClassResource:
    enabled: true
  stats:
    enabled: true
  metrics:
    enabled: true
  serviceMonitor:
    enabled: true
    labels:
      release: prometheus
    metrics:
      relabelings:
      - replacement: cl1
        targetLabel: cluster
      - sourceLabels: [__meta_kubernetes_pod_node_name]
        targetLabel: hostname
    ctrlMetrics:
      relabelings:
      - replacement: cl1
        targetLabel: cluster
      - sourceLabels: [__meta_kubernetes_pod_node_name]
        targetLabel: hostname
There are two important configurations in the snippet above:
- Added a label
release: prometheusin the ServiceMonitor. HAProxy Ingress metrics will share the same Prometheus instance installed by Prometheus Operator. This can be changed to another dedicated instance, and must be checked if using another customized Prometheus Operator deployment. - Added relabels to HAProxy and HAProxy Ingress metrics. The HAProxy Ingress dashboard uses
hostnamelabel as a way to distinguish two controller instances, and alsoclusterlabel to distinguish controllers running on distinct clusters. The source of the name can be adjusted but the label name should be the same.
Now install or upgrade the chart:
helm upgrade haproxy-ingress haproxy-ingress/haproxy-ingress\
  --install\
  --create-namespace --namespace ingress-controller\
  -f haproxy-ingress-values.yaml
Compatibility
This dashboard works with HAProxy’s internal Prometheus exporter. Follow these steps to adjust the scrape config and the dashboard if using Prometheus’ HAProxy Exporter:
Change the metric name of “Backend status / Top 5 max/avg connection time” to haproxy_backend_http_connect_time_average_seconds
Add this relabel configuration in the haproxy-ingress-values.yaml file
controller:
  ...
  serviceMonitor:
    ...
    metrics:
      ...
      metricRelabelings:
      - sourceLabels: [frontend]
        targetLabel: proxy
      - sourceLabels: [backend]
        targetLabel: proxy
Configure the dashboard
Import this Grafana dashboard. If Grafana was deployed using the steps provided in this walkthrough:
Minimum HAProxy Ingress version is v0.14, use revision 3 if using on an older one.
- Open Grafana page - the URL is the same provided in the
prometheus-operator-values.yamlfile and should resolve to the ingress deployment - Log in to Grafana, the
prometheus-operator-values.yamlfile configures user asadminand the password asprom-operator - Click
Dashboards,New,Import, type12056as the Grafana.com ID, Load, select a Prometheus datasource, Import
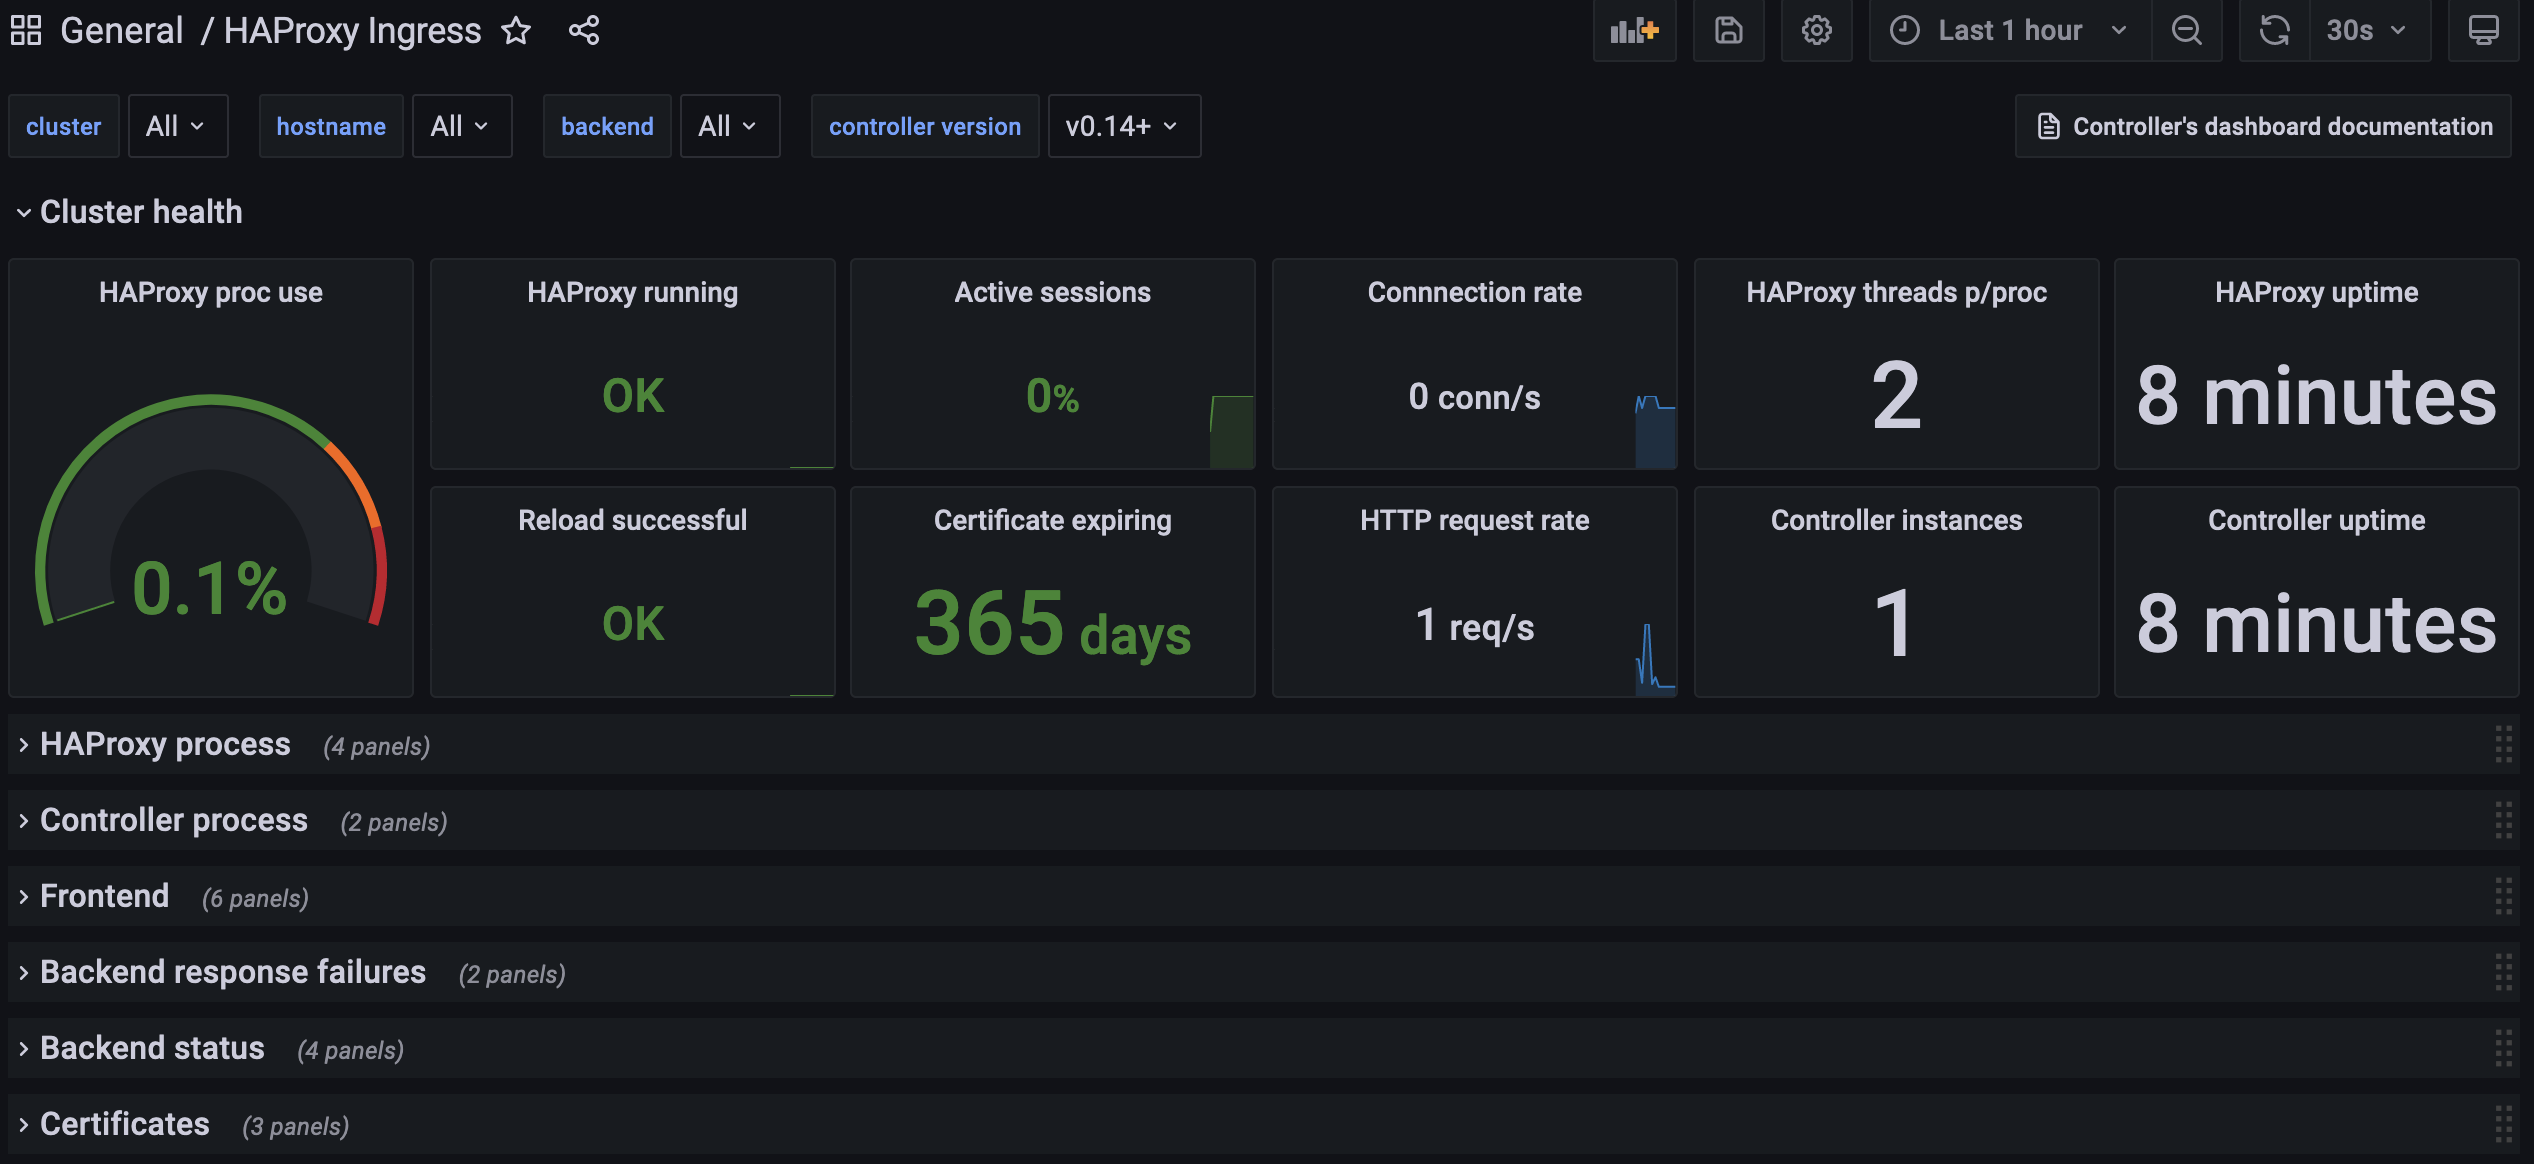
If everything worked as expected, the dashboard should look like this:
Test
Lets make some noise and see what the dashboard tell us about our HAProxy Ingress cluster.
Deploy a demo application and a custom (self-signed) certificate:
openssl req -x509 -subj "/CN=dory.localdomain" -nodes -days 30 -newkey rsa:2048 -keyout /tmp/h.key -out /tmp/h.crt
kubectl --namespace default create secret tls dory --cert /tmp/h.crt --key /tmp/h.key
rm -fv /tmp/h.crt /tmp/h.key
kubectl --namespace default create deploy dory --image jcmoraisjr/dory
kubectl --namespace default scale deploy dory --replicas=4
kubectl --namespace default expose deploy dory --port 8000
kubectl --namespace default create ingress dory\
  --class=haproxy\
  --annotation haproxy-ingress.github.io/ssl-redirect=false\
  --rule="dory.localdomain/*=dory:8000,tls=dory"
Check if the app is up and running:
kubectl --namespace default get pod -lapp=dory -w
Download vegeta and place it in the path.
Make a test and check if everything is working as expected. Change IP below to the IP of a HAProxy Ingress node:
IP=192.168.0.11
## Using Fish?
# set IP 192.168.0.11
echo "GET http://$IP" |\
  vegeta attack -duration=1s -rate=1 -header "Host: dory.localdomain" -keepalive=true |\
  vegeta report
The output should look like this. The most important part is Success ratio=100% and an Error Set empty:
...
Success       [ratio]                    100.00%
Status Codes  [code:count]               200:1
Error Set:
Now the real test. Adjust the duration and rate (number of requests per second) if needed. A dual core VM dedicated to HAProxy Ingress should accept a few thousands requests per second. Lets configure 200 which should move some lines in the dashboard:
IP=192.168.0.11
echo "GET http://$IP" |\
  vegeta attack -duration=5m -rate=200 -header "Host: dory.localdomain" -keepalive=true |\
  vegeta report
Follow the dashboard while the test is running. Most metrics have its resolution in 1m (one minute) so wait at least this amount of time to see the correct conns/s, rps, proc use and so on.
What’s the impact of not using keepalive? Try the same test, changing only -keepalive to false:
IP=192.168.0.11
ulimit -n 2048 # avoids 'too many open files' error in the client side
echo "GET http://$IP" |\
  vegeta attack -duration=5m -rate=200 -header "Host: dory.localdomain" -keepalive=false |\
  vegeta report
Last test: what about TLS connections without keepalive? Change http to https and add -insecure command-line option to Vegeta:
IP=192.168.0.11
ulimit -n 2048
echo "GET https://$IP" |\
  vegeta attack -insecure -duration=5m -rate=200 -header "Host: dory.localdomain" -keepalive=false |\
  vegeta report